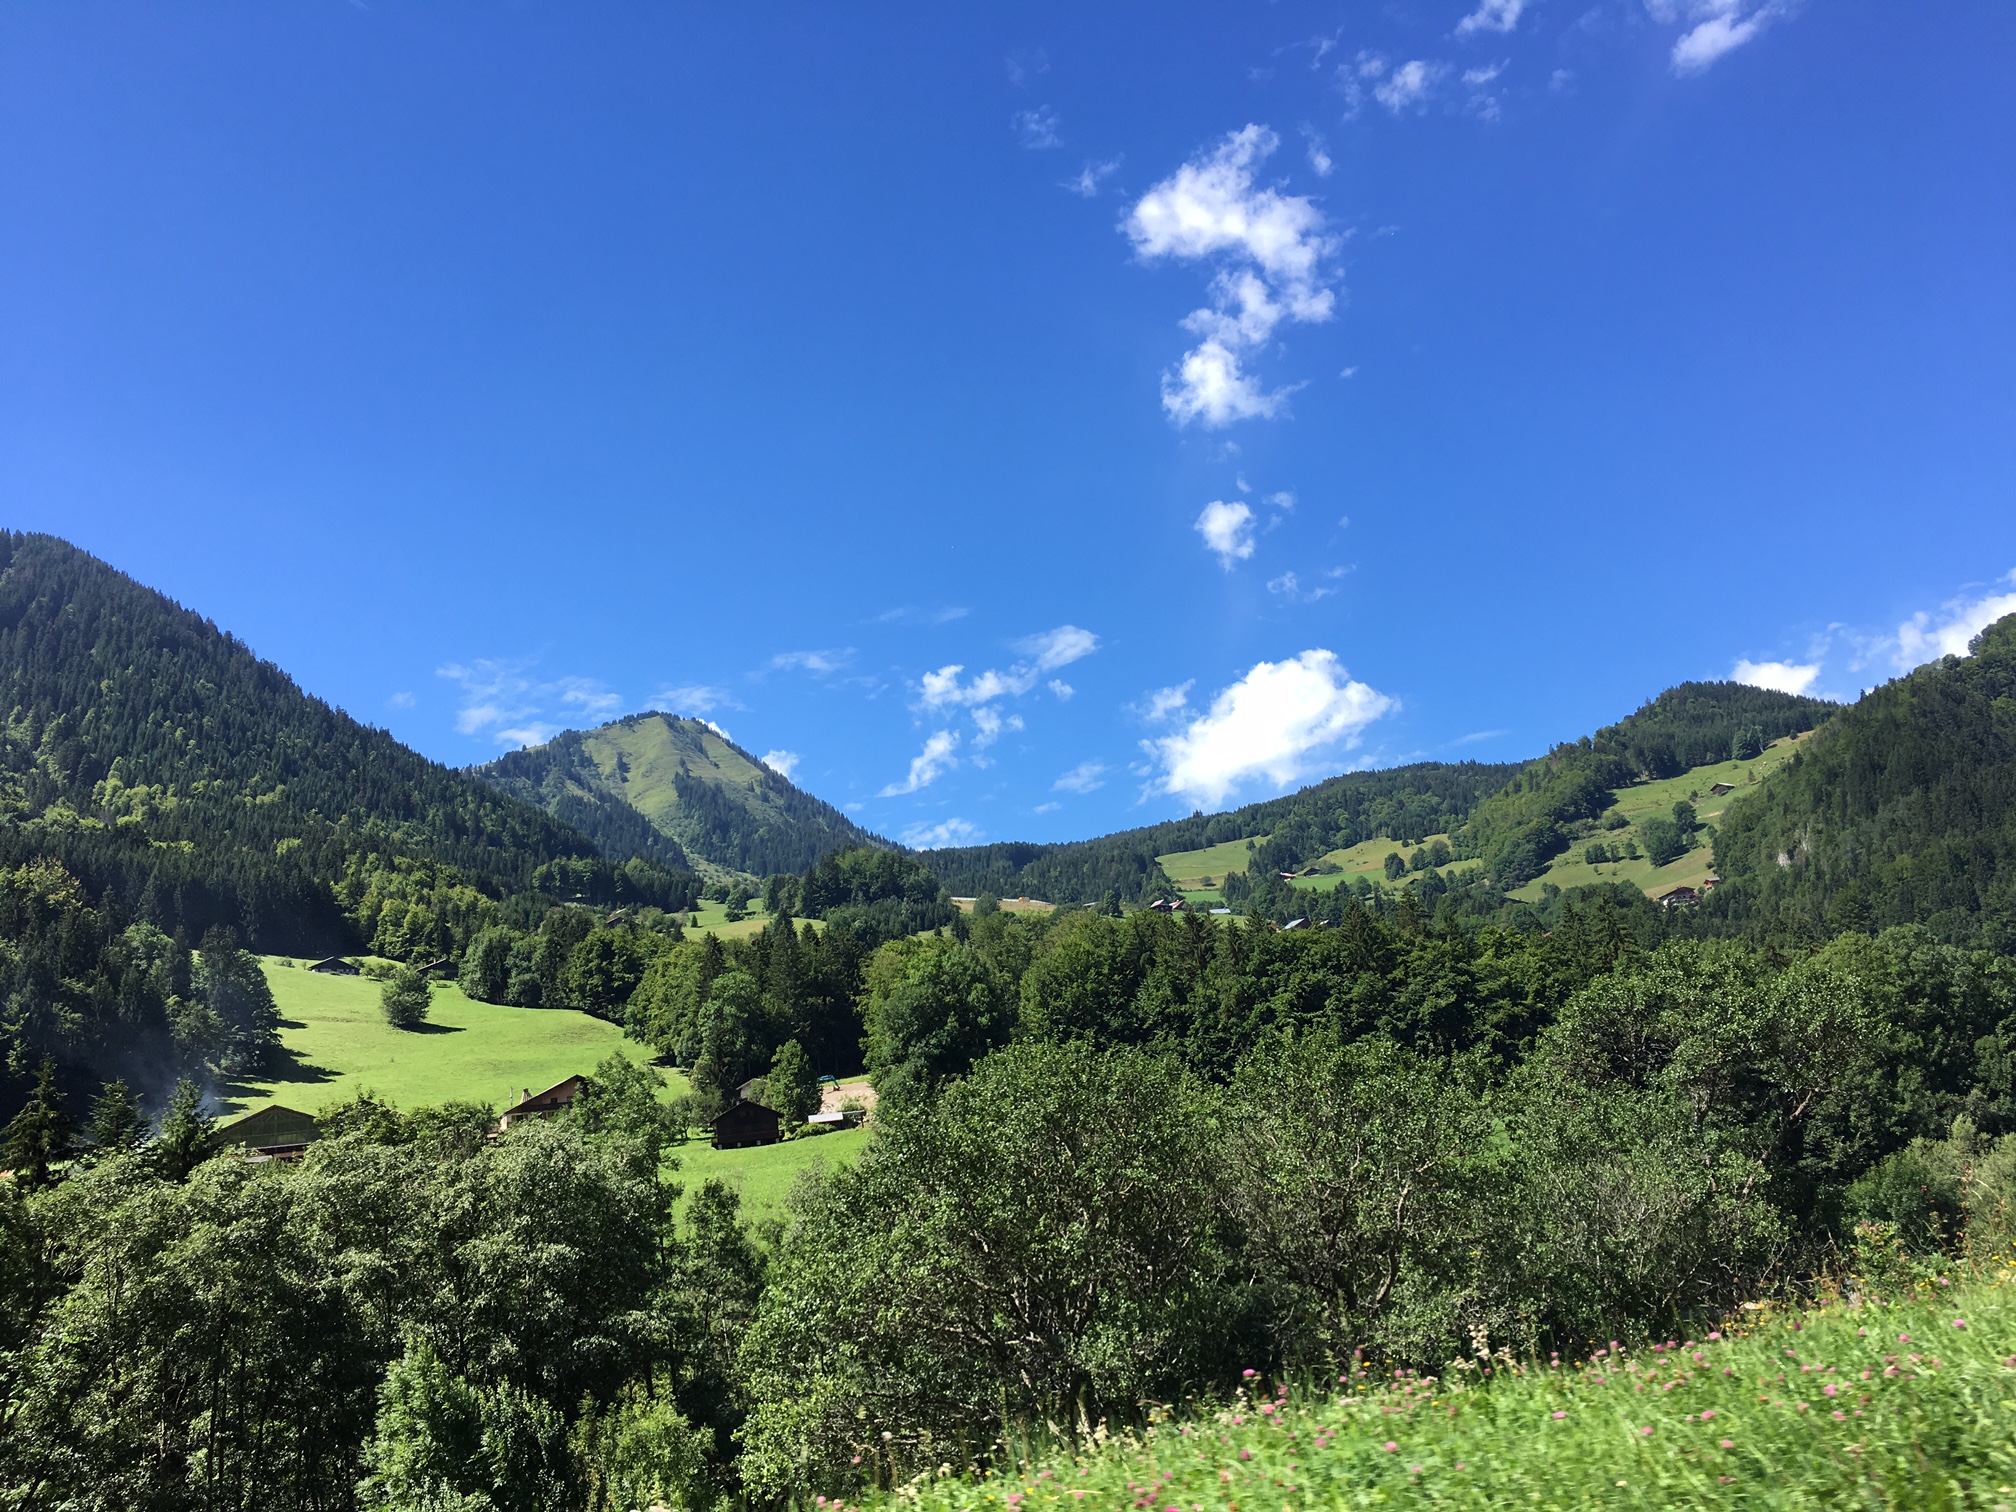
WEATHER CLIMATE WATER


WMO for YOUTH
WMO for YOUTH
Fast facts on weather, climate & water
 ©
VladisChern
©
VladisChern
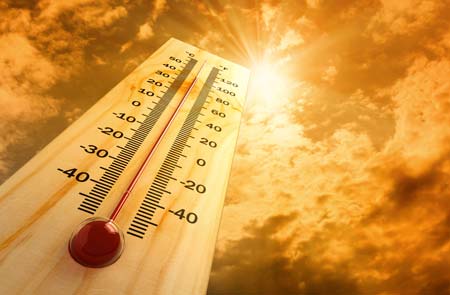
In chronological order:
 ©
WMO
©
WMO
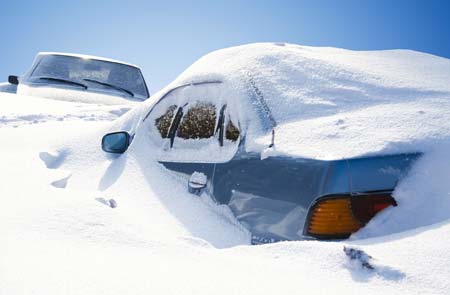 ©
Indigo Fish
©
Indigo Fish